1. Q.I moyen par pays par ordre décroissant
2. Les bases raciales du Q.I moyen national
3. Lien entre Q.I moyen et salaire moyen
4. Relation exponentielle entre le Q.I et le salaire moyen (relation plus correcte que la régression linéaire)
5. Autres mesures corrélées au Q.I moyen national.
1. Q.I moyen par pays par ordre décroissant
Deux valeurs sont données pour le Q.I moyen national, celle de 2002 (I.Q and the wealth of nations) et celle de 2006 (I.Q and global inequality). Les valeurs de 2006 sont les plus valables.
Elles varient peu quoique le Q.I moyen en Asie de l'est soit revu à la hausse, surtout en Chine (La valeur de 100 pour la Chine en 2002 était une sous-estimation). Le Q.I moyen de l'Europe de l'ouest est lui légèrement revu à la baisse (Australie, Luxembourg, Pays-Bas, Allemagne, Belgique) sans doute parce que le Q.I moyen diminue tandis que la part d'afro-maghrébins, qui ont un Q.I nettement plus faible que celui des européens natifs, augmente dans ces pays.
Il apparait déjà que les Q.I moyens nationaux sont essentiellement déterminés par les proportions des différentes races dans les différents pays. (Voir point 2)
|
Country/Region
|
IQ (2002)[2]
|
IQ (2006)[1]
|
PPP-GNI per capita 2002[1]
|
QHC[1]
|
|
Hong Kong
|
107
|
108
|
27,490
|
60.8
|
|
Singapore
|
103
|
108
|
23,730
|
60.7
|
|
North Korea
|
105*
|
106*
|
1,000
|
38
|
|
South Korea
|
106
|
106
|
16,960
|
75.4
|
|
Japan
|
105
|
105
|
27,380
|
71.4
|
|
Taiwan
|
104
|
105
|
23,400
|
79.4
|
|
China
|
100
|
105
|
4,520
|
39.7
|
|
Italy
|
102
|
102
|
26,170
|
78.9
|
|
Iceland
|
98*
|
101
|
29,240
|
80
|
|
Mongolia
|
98*
|
101*
|
1,710
|
48.1
|
|
Switzerland
|
101
|
101
|
31,840
|
82.2
|
|
Austria
|
102
|
100
|
28,910
|
80.7
|
|
Luxembourg
|
101*
|
100*
|
53,230
|
76.4
|
|
Netherlands
|
102
|
100
|
28,350
|
82.8
|
|
Norway
|
98
|
100
|
36,690
|
89
|
|
United Kingdom
|
100
|
100
|
26,580
|
76.7
|
|
Germany
|
102
|
99
|
26,980
|
78
|
|
Belgium
|
100
|
99
|
28,130
|
84.1
|
|
Canada
|
97
|
99
|
28,930
|
77.8
|
|
Estonia
|
97*
|
99
|
11,630
|
64.5
|
|
Finland
|
97
|
99
|
26,160
|
85.1
|
|
New Zealand
|
100
|
99
|
20,550
|
76.2
|
|
Poland
|
99
|
99
|
10,450
|
62.7
|
|
Sweden
|
101
|
99
|
25,820
|
82.9
|
|
Andorra
|
N/A
|
98*
|
19,000
|
58.7
|
|
Spain
|
99
|
98
|
21,910
|
75.8
|
|
Australia
|
98
|
98
|
27,440
|
82.8
|
|
Czech Republic
|
97
|
98
|
14,920
|
64.5
|
|
Denmark
|
98
|
98
|
30,600
|
85.4
|
|
France
|
98
|
98
|
27,040
|
78.1
|
|
Hungary
|
99
|
98
|
13,070
|
64.1
|
|
Latvia
|
97*
|
98*
|
9,190
|
65.5
|
|
United States
|
98
|
98
|
36,120
|
86.6
|
|
Belarus
|
96*
|
97*
|
5,500
|
57.2
|
|
Malta
|
95*
|
97
|
17,710
|
66.4
|
|
Russia
|
96
|
97
|
8,080
|
64.5
|
|
Ukraine
|
96*
|
97*
|
4,800
|
61.8
|
|
Moldova
|
95*
|
96*
|
1,600
|
46.2
|
|
Slovakia
|
96
|
96
|
12,590
|
63.2
|
|
Uruguay
|
96
|
96
|
7,710
|
64
|
|
Israel
|
94
|
95
|
19,000
|
75.3
|
|
Portugal
|
95
|
95
|
17,820
|
67
|
|
Armenia
|
93*
|
94*
|
3,230
|
50.2
|
|
Georgia
|
93*
|
94*
|
2,270
|
51.2
|
|
Kazakhstan
|
93*
|
94*
|
5,630
|
49
|
|
Romania
|
94
|
94
|
6,490
|
53
|
|
Vietnam
|
96*
|
94*
|
2,300
|
39.5
|
|
Argentina
|
96
|
93
|
10,190
|
64.7
|
|
Bulgaria
|
93
|
93
|
7,030
|
59.1
|
|
Greece
|
92
|
92
|
18,770
|
76.1
|
|
Malaysia
|
92
|
92
|
29,570
|
78.5
|
|
Ireland
|
93
|
92
|
8,500
|
52.1
|
|
Brunei
|
92*
|
91*
|
19,210
|
50.8
|
|
Cambodia
|
89*
|
91*
|
1,970
|
28.6
|
|
Cyprus
|
92*
|
91*
|
18,650
|
67.6
|
|
Lithuania
|
97*
|
91
|
10,190
|
65.4
|
|
Republic of Macedonia
|
93*
|
91*
|
6,420
|
54.4
|
|
Thailand
|
91
|
91
|
6,890
|
50.3
|
|
Albania
|
90*
|
90*
|
4,960
|
51.2
|
|
Bermuda
|
N/A
|
90
|
36,000
|
75.8
|
|
Bosnia and Herzegovina
|
N/A
|
90*
|
5,800
|
51.4
|
|
Chile
|
93*
|
90
|
9,420
|
59.5
|
|
Croatia
|
90
|
90
|
10,000
|
61.7
|
|
Kyrgyzstan
|
87*
|
90*
|
1,560
|
48.1
|
|
Turkey
|
90
|
90
|
6,300
|
50.2
|
|
Mexico
|
87
|
90
|
12,500
|
52.9
|
|
Cook Islands
|
N/A
|
89
|
5,000
|
45.7
|
|
Costa Rica
|
91*
|
89*
|
8,650
|
53.7
|
|
Laos
|
89*
|
89
|
1,660
|
24.9
|
|
Mauritius
|
81*
|
89
|
10,820
|
52.2
|
|
Suriname
|
89
|
89
|
6,590
|
50.6
|
|
Ecuador
|
80
|
88
|
3,340
|
47.4
|
|
Samoa
|
87
|
88
|
5,570
|
49.7
|
|
Azerbaijan
|
87*
|
87*
|
3,010
|
47.2
|
|
Bolivia
|
85*
|
87
|
2,390
|
49.7
|
|
Brazil
|
87
|
87
|
7,450
|
51.1
|
|
East Timor
|
N/A
|
87*
|
3,940
|
46.7
|
|
Guyana
|
84*
|
87*
|
3,070
|
40.2
|
|
Indonesia
|
89
|
87
|
1,600
|
28.1
|
|
Iraq
|
87
|
87
|
1,027
|
30.7
|
|
Myanmar
|
86*
|
87*
|
930
|
42.4
|
|
Tajikistan
|
87*
|
87*
|
1,640
|
27.5
|
|
Turkmenistan
|
87*
|
87*
|
4,780
|
41.7
|
|
Uzbekistan
|
87*
|
87*
|
1,640
|
39.4
|
|
Kuwait
|
83*
|
86
|
17,780
|
49.9
|
|
Philippines
|
86
|
86
|
4,450
|
51.6
|
|
Seychelles
|
81*
|
86*
|
18,232
|
60.6
|
|
Tonga
|
87
|
86
|
6,820
|
40.5
|
|
Cuba
|
85
|
85
|
5,259
|
46.2
|
|
Fiji
|
84
|
85
|
5,330
|
51.9
|
|
Kiribati
|
84*
|
85*
|
800
|
37.1
|
|
New Caledonia
|
N/A
|
85
|
21,960
|
54.9
|
|
Peru
|
90
|
85
|
4,880
|
49.2
|
|
Trinidad and Tobago
|
80*
|
85*
|
9,000
|
52
|
|
Yemen
|
83*
|
85
|
800
|
24.5
|
|
Afghanistan
|
83*
|
84*
|
700
|
13.2
|
|
Belize
|
83*
|
84*
|
15,960
|
56.1
|
|
Colombia
|
88
|
84
|
5,490
|
44.2
|
|
Federated States of Micronesia
|
84*
|
84*
|
6,150
|
48.4
|
|
Iran
|
84
|
84
|
6,690
|
40.2
|
|
Jordan
|
87*
|
84
|
4,180
|
43.4
|
|
Marshall Islands
|
84
|
84
|
1,600
|
44.2
|
|
Morocco
|
85
|
84
|
2,000
|
39.9
|
|
Pakistan
|
81*
|
84
|
3,730
|
31.7
|
|
Panama
|
84*
|
84*
|
1,960
|
26.2
|
|
Paragay
|
85*
|
84
|
6,060
|
56.6
|
|
Puerto Rico
|
84
|
84
|
4,590
|
45.2
|
|
Saudi Arabia
|
83*
|
84*
|
15,800
|
63.6
|
|
Solomon Islands
|
84*
|
84*
|
12,660
|
44.1
|
|
The Bahamas
|
78*
|
84*
|
1,590
|
41.5
|
|
United Arab Emirates
|
83*
|
84*
|
24,030
|
48.8
|
|
Vanuatu
|
84*
|
84*
|
2,850
|
31.4
|
|
Venezuela
|
88*
|
84
|
5,220
|
47.4
|
|
Algeria
|
84*
|
83*
|
5,530
|
39.9
|
|
Bahrain
|
83*
|
83*
|
16,190
|
49.3
|
|
Libya
|
84*
|
83*
|
7,570
|
49.3
|
|
Oman
|
83*
|
83*
|
13,000
|
40.6
|
|
Papua New Guinea
|
84*
|
83
|
2,180
|
38.4
|
|
Syria
|
87*
|
83
|
5,348
|
38.9
|
|
Tunisia
|
84*
|
83*
|
6,440
|
40.6
|
|
Bangladesh
|
81*
|
82*
|
1,720
|
29.8
|
|
Dominican Republic
|
84*
|
82
|
6,270
|
46.8
|
|
India
|
81
|
82
|
2,650
|
36.3
|
|
Lebanon
|
86
|
82
|
4,600
|
55.8
|
|
Madagascar
|
79*
|
82
|
730
|
28.6
|
|
Egypt
|
83
|
81
|
3,810
|
37.3
|
|
Honduras
|
84*
|
81
|
2,540
|
41.9
|
|
Maldives
|
81*
|
81*
|
4,798
|
38.5
|
|
Nicaragua
|
84*
|
81*
|
2,350
|
41.3
|
|
Northern Mariana Islands
|
N/A
|
81
|
12,500
|
51.3
|
|
Barbados
|
78
|
80
|
14,660
|
60.9
|
|
Bhutan
|
78*
|
80*
|
1,969
|
24.1
|
|
El Salvador
|
84*
|
80*
|
4,790
|
42.6
|
|
Guatemala
|
79
|
79
|
4,040
|
34.6
|
|
Sri Lanka
|
81*
|
79
|
3,510
|
47.7
|
|
Nepal
|
78
|
78
|
1,370
|
26.9
|
|
Qatar
|
78
|
78
|
19,844
|
45.6
|
|
Comoros
|
79*
|
77*
|
1,640
|
24.6
|
|
Cape Verde
|
78*
|
76*
|
4,920
|
40.5
|
|
Mauritania
|
73*
|
76*
|
1,790
|
20.5
|
|
Uganda
|
73
|
73
|
1,360
|
25.4
|
|
Kenya
|
72
|
72
|
1,010
|
27.3
|
|
South Africa
|
72
|
72
|
9,810
|
38.3
|
|
Tanzania
|
72
|
72
|
580
|
23.2
|
|
Ghana
|
71
|
71
|
2,080
|
33.7
|
|
Grenada
|
75*
|
71*
|
6,600
|
45.3
|
|
Jamaica
|
72
|
71
|
3,680
|
46.5
|
|
Saint Vincent and the Grenadines
|
75*
|
71
|
5,190
|
48.4
|
|
Sudan
|
72
|
71
|
1,740
|
24.6
|
|
Zambia
|
77
|
71
|
800
|
21.8
|
|
Antigua and Barbuda
|
75*
|
70*
|
10,390
|
53.2
|
|
Benin
|
69*
|
70*
|
1,060
|
20.5
|
|
Botswana
|
72*
|
70*
|
7,740
|
29.4
|
|
Namibia
|
72*
|
70*
|
6,880
|
31.1
|
|
Rwanda
|
70*
|
70*
|
1,260
|
18.5
|
|
Togo
|
69*
|
70*
|
1,450
|
26
|
|
Burundi
|
70*
|
69*
|
630
|
15.2
|
|
Côte d'Ivoire
|
71*
|
69*
|
1,450
|
18.1
|
|
Malawi
|
71*
|
69*
|
570
|
24.3
|
|
Mali
|
68*
|
69*
|
840
|
13.4
|
|
Niger
|
67*
|
69*
|
800
|
13.5
|
|
Nigeria
|
67
|
69
|
800
|
27.3
|
|
Angola
|
69*
|
68*
|
1,840
|
13.7
|
|
Burkina Faso
|
66*
|
68*
|
1,090
|
10.7
|
|
Chad
|
72*
|
68*
|
1,010
|
20.4
|
|
Djibouti
|
68*
|
68*
|
2,040
|
22
|
|
Eritrea
|
68*
|
68*
|
1,040
|
21.4
|
|
Somalia
|
68*
|
68*
|
500
|
15.2
|
|
Swaziland
|
72*
|
68*
|
4,730
|
22.2
|
|
Dominica
|
75*
|
67
|
4,960
|
48.8
|
|
Guinea
|
63
|
67
|
2,060
|
22.5
|
|
Guinea-Bissau
|
63*
|
67*
|
680
|
20.3
|
|
Haiti
|
72*
|
67*
|
1,610
|
20.4
|
|
Lesotho
|
72*
|
67*
|
2,970
|
24.3
|
|
Liberia
|
64*
|
67*
|
1,000
|
21.2
|
|
Saint Kitts and Nevis
|
75*
|
67*
|
10,750
|
45.5
|
|
São Tomé and Príncipe
|
59*
|
67*
|
1,317
|
37.9
|
|
Senegal
|
64*
|
66*
|
1,660
|
20.7
|
|
The Gambia
|
64*
|
66*
|
1,540
|
21.3
|
|
Zimbabwe
|
66
|
66
|
2,180
|
25.2
|
|
Republic of the Congo
|
73
|
65
|
630
|
17.9
|
|
Cameroon
|
70*
|
64
|
1,910
|
23.1
|
|
Central African Republic
|
68*
|
64
|
1,170
|
19.1
|
|
Democratic Republic of the Congo
|
65
|
64
|
700
|
26.9
|
|
Ethiopia
|
63
|
64
|
780
|
16.7
|
|
Gabon
|
66*
|
64*
|
5,530
|
32.2
|
|
Mozambique
|
72*
|
64
|
990
|
18
|
|
Sierra Leone
|
64
|
64
|
500
|
13.8
|
|
Saint Lucia
|
75*
|
62
|
4,950
|
51.1
|
|
Equatorial Guinea
|
59
|
59
|
9,100
|
30.4
|
|
"*" Denotes estimated National IQ
PPP-GNI = purchasing power parity gross national income. QHC = is a composite index called quality of human conditions.
|
||||
2. Les bases raciales du Q.I moyen national.
|
Race
|
IQ
|
Brain Size (cc)
|
|
East Asians
|
106
|
1416
|
|
Europeans
|
99
|
1369
|
|
Southeast Asians
|
90
|
1332
|
|
Pacific Islanders
|
85
|
1317
|
|
South Asians
|
84
|
1293
|
|
Africans
|
67
|
1282
|
|
Nations-Race
|
IQ
|
|
East Asian
|
105
|
|
China
|
105
|
|
Hong Kong
|
108
|
|
Japan
|
105
|
|
Singapore
|
108
|
|
South Korea
|
106
|
|
Taiwan
|
105
|
|
|
|
|
European
|
99
|
|
Australie
|
98
|
|
Austria
|
100
|
|
Belgium
|
99
|
|
Canada
|
99
|
|
Czech Republic
|
98
|
|
Denmark
|
98
|
|
Estonie
|
99
|
|
Finland
|
99
|
|
France
|
98
|
|
Germant'
|
99
|
|
Hungary
|
98
|
|
Iceland
|
98
|
|
Ireland
|
92
|
|
Italy
|
102
|
|
Lithuanie
|
91
|
|
Malta
|
97
|
|
Netherlands
|
100
|
|
New Zeeland
|
99
|
|
Norway
|
100
|
|
Poland
|
99
|
|
Portugal
|
95
|
|
Russie
|
97
|
|
Slovakia
|
96
|
|
Slovenia
|
96
|
|
Spain
|
98
|
|
Sweden
|
99
|
|
Nations
|
IQ
|
|
Switzerland
|
101
|
|
United Kingdom
|
100
|
|
United States
|
98
|
|
|
|
|
European-South-Asian
|
92
|
|
Bulgaria
|
93
|
|
Croatie
|
90
|
|
Greece
|
92
|
|
Israel
|
95
|
|
Turkey
|
90
|
|
Romania
|
94
|
|
Serbie
|
89
|
|
|
|
|
Southeast Asian
|
90
|
|
Indonesia
|
87
|
|
Laos
|
88
|
|
Malaysia
|
92
|
|
Philippines
|
86
|
|
Thailand
|
91
|
|
Vietnam
|
94
|
|
|
|
|
Pacific Islanders
|
85
|
|
Cook Islands
|
89
|
|
Fiji
|
85
|
|
Mariana Islands
|
81
|
|
Marshall Islands
|
84
|
|
New Caledonia
|
85
|
|
Papua New Guinea
|
83
|
|
Tonga
|
86
|
|
Western Samoa
|
88
|
|
|
|
|
|
|
|
South Asia/N. Africa
|
84
|
|
Egypt
|
81
|
|
India
|
82
|
|
Nations
|
IQ
|
|
Iran
|
84
|
|
Iraq
|
87
|
|
Jordan
|
84
|
|
Kuwait
|
86
|
|
Lebanon
|
82
|
|
Mauritius
|
89
|
|
Morocco
|
84
|
|
Nepal
|
78
|
|
Pakistan
|
84
|
|
Qatar
|
78
|
|
Sri Lanka
|
79
|
|
Syrie
|
83
|
|
Yemen
|
85
|
|
|
|
|
S-Saharan African
|
67
|
|
Cameroon
|
64
|
|
Cent. African Republic
|
64
|
|
Congo-Brazzaville
|
64
|
|
Congo-Zaire
|
65
|
|
Equatorial Guinea
|
59
|
|
Ethiopia
|
64
|
|
Ghana
|
71
|
|
Guinea
|
67
|
|
Kenya
|
72
|
|
Mozambique
|
64
|
|
Nigeria
|
69
|
|
Sierra Leone
|
64
|
|
South Africa
|
72
|
|
Sudan
|
71
|
|
Swaziland
|
72
|
|
Tanzanie
|
72
|
|
Uganda
|
73
|
|
Zambie
|
71
|
|
Zimbabwe
|
66
|
|
Nations
|
Measured
IQ
|
predicted
IQ
|
Racial Composition
|
|
Argentine
|
93
|
97
|
85% European, 15% Amerindian & Mestizo
|
|
Barbados
|
80
|
71
|
80% African, 16% Mulatto, 4% European
|
|
Bermuda
|
90
|
85
|
61 % African & Mulatto, 37% European
|
|
Bolivie
|
87
|
88
|
42% Amerindian, 31% Mestizo, 15% European
|
|
Brazil
|
87
|
90
|
53% European, 3% Amerindian, 12%
Mestizo, 11 % African, 22% Mulatto
|
|
Chile
|
90
|
92
|
92% Mestizo & European, 7% Amerindian
|
|
Colombie
|
84
|
89
|
1% Amerindian, 58% Mestizo,
20% European, 4% African, 14%
Mulatto, 3% African-Amerindian
|
|
Cuba
|
85
|
92
|
12% African, 22% Mulatto, 66% European
|
|
Dominica
|
67
|
68
|
90% African, 6% Mulatto, 4% Amerindian
|
|
Dominican
Republic
|
82
|
84
|
11% African, 73% Mulatto, 16% European
|
|
Ecuador
|
88
|
87
|
40% Amerindian, 40% Mestizo,
5% European, 5% African
|
|
Guatemala
|
79
|
85
|
55% Amerindian, 42% Mestizo, 3% European
|
|
Honduras
|
81
|
90
|
90% Mestizo, 7% Amerindian
|
|
Jamaica
|
71
|
71
|
76% African, 15% Mulatto, 3%
European, 3% East Indian
|
|
Mexico
|
88
|
88
|
30% Amerindian, 60% Mestizo, 9% European
|
|
Paraguay
|
84
|
91
|
3% Amerindian, 90% Mestizo, 7% European
|
|
Puerto Rico
|
84
|
93
|
76% European, 24% African & Mulatto
|
|
St. Lucia
|
62
|
75
|
90% African, 6% Mulatto, 3% East Indian
|
|
St. Vincent
|
71
|
73
|
65% African, 23% mixed and other, 6% East
Indian, 2% Amerindian, 4% European
|
|
Suriname
|
89
|
83
|
10% African, 35% Mulatto, 3% Amerindian,
33% East Indian, 16% SE Asian
|
|
Uruguay
|
96
|
96
|
8% Mestizo, 86% European, 6% African
|
|
Venezuela
|
84
|
85
|
67% Mestizo, 21% European, 10%
African, 2% Amerindian
|
3. Salaire moyen prédit suivant la régression linéaire. (Lynn et Vanhanen 2002)
|
Ref |
QI MOYEN PAR PAYS SELON R. LYNN & T VANHANEN |
CHIFFRE |
|
23 |
Corrélation avec la réussite économique Environ 75% de la variance économique entre les pays s'explique par le QI moyen de la population. 3 éléments viennent baisser la corrélation (qui, sans eux, serait plus importante) :
LEGENDE :
|
0,757 |
|
Pays |
Q.I moyen |
GDP |
fitted GDP |
GDP/FGDP |
|
Hong Kong |
107 |
20 763 |
19 817 |
1,0477368 |
|
Korea, South |
106 |
13 478 |
19 298 |
0,6984143 |
|
Japan |
105 |
23 257 |
18 779 |
1,2384579 |
|
Taiwan |
104 |
13 000 |
18 260 |
0,7119387 |
|
Singapore |
103 |
24 210 |
17 740 |
1,3647125 |
|
Austria |
102 |
23 166 |
17 221 |
1,345218 |
|
Germany |
102 |
22 169 |
17 221 |
1,2873236 |
|
Italy |
102 |
20 585 |
17 221 |
1,1953429 |
|
Netherlands |
102 |
22 176 |
17 221 |
1,2877301 |
|
Sweden |
101 |
20 659 |
16 702 |
1,2369177 |
|
Switzerland |
101 |
25 512 |
16 702 |
1,5274817 |
|
Belgium |
100 |
23 223 |
16 183 |
1,4350244 |
|
China |
100 |
3 105 |
16 183 |
0,191868 |
|
NewZealand |
100 |
17 288 |
16 183 |
1,0682815 |
|
U. Kingdom |
100 |
20 336 |
16 183 |
1,2566273 |
|
Hungary |
99 |
10 232 |
15 664 |
0,6532176 |
|
Poland |
99 |
7 619 |
15 664 |
0,4864019 |
|
Australia |
98 |
22 452 |
15 145 |
1,4824695 |
|
Denmark |
98 |
24 218 |
15 145 |
1,5990756 |
|
France |
98 |
21 175 |
15 145 |
1,3981512 |
|
Norway |
98 |
26 342 |
15 145 |
1,7393199 |
|
United States |
98 |
29 605 |
15 145 |
1,9547706 |
|
Canada |
97 |
23 582 |
14 626 |
1,6123342 |
|
Czech Republic |
97 |
12 362 |
14 626 |
0,8452072 |
|
Finland |
97 |
20 847 |
14 626 |
1,4253384 |
|
Spain |
97 |
16 212 |
14 626 |
1,108437 |
|
Argentina |
96 |
12 013 |
14 107 |
0,8515631 |
|
Russia |
96 |
6 460 |
14 107 |
0,4579287 |
|
Slovakia |
96 |
9 699 |
14 107 |
0,687531 |
|
Uruguay |
96 |
8 623 |
14 107 |
0,6112568 |
|
Portugal |
95 |
14 701 |
13 589 |
1,0818309 |
|
Slovenia |
95 |
14 293 |
13 588 |
1,051884 |
|
Israel |
94 |
17 301 |
13 069 |
1,3238197 |
|
Romania |
94 |
5 648 |
13 069 |
0,4321677 |
|
Bulgaria |
93 |
4 809 |
12 550 |
0,3831873 |
|
Ireland |
93 |
21 482 |
12 550 |
1,7117131 |
|
Greece |
92 |
13 943 |
12 031 |
1,1589228 |
|
Malaysia |
92 |
8 137 |
12 031 |
0,6763361 |
|
Thailand |
91 |
5 456 |
11 512 |
0,4739402 |
|
Croatia |
90 |
6 749 |
10 993 |
0,6139361 |
|
Peru |
90 |
4 282 |
10 993 |
0,3895206 |
|
Turkey |
90 |
6 422 |
10 993 |
0,5841899 |
|
Colombia |
89 |
6 006 |
10 474 |
0,5734199 |
|
Indonesia |
89 |
2 651 |
10 474 |
0,2531029 |
|
Suri name |
89 |
5 161 |
10 474 |
0,4927439 |
|
Brazil |
87 |
6 625 |
9 436 |
0,7020983 |
|
Iraq |
87 |
3 197 |
9 436 |
0,3388088 |
|
Mexico |
87 |
7 704 |
9 436 |
0,8164476 |
|
Samoa (Western) |
87 |
3 832 |
9 436 |
0,4061043 |
|
Tonga |
87 |
3 000 |
9 436 |
0,3179313 |
|
Lebanon |
86 |
4 326 |
8 917 |
0,4851407 |
|
Philippines |
86 |
3 555 |
8 917 |
0,3986767 |
|
Cuba |
85 |
3 967 |
8 398 |
0,4723744 |
|
Morocco |
85 |
3 305 |
8 398 |
0,3935461 |
|
Fiji |
84 |
4 231 |
7 879 |
0,5369971 |
|
Iran |
84 |
5 121 |
7 879 |
0,6499556 |
|
Marshall Islands |
84 |
3 000 |
7 879 |
0,380759 |
|
Puerto Rico |
84 |
8 000 |
7 879 |
1,0153573 |
|
Egypt |
83 |
3 041 |
7 360 |
0,4131793 |
|
India |
81 |
2 077 |
6 322 |
0,3285353 |
|
Ecuador |
80 |
3 003 |
5 803 |
0,517491 |
|
Guatemala |
79 |
3 505 |
5 284 |
0,6633232 |
|
Barbados |
78 |
12 001 |
4 765 |
2,5185729 |
|
Nepal |
78 |
1 157 |
4 765 |
0,2428122 |
|
Qatar |
78 |
20 987 |
4 765 |
4,4044071 |
|
Zambia |
77 |
719 |
4 246 |
0,1693358 |
|
Congo (Brazz) |
73 |
995 |
2 170 |
0,4585253 |
|
Uganda |
73 |
1 074 |
2 170 |
0,4949309 |
|
Jamaica |
72 |
3 389 |
1 651 |
2,0526953 |
|
Kenya |
72 |
980 |
1 651 |
0,5935796 |
|
South Africa |
72 |
8 488 |
1 651 |
5,1411266 |
|
Sudan |
72 |
1 394 |
1 651 |
0,8443368 |
|
Tanzania |
72 |
480 |
1 651 |
0,2907329 |
|
Ghana |
71 |
1 735 |
1 132 |
1,5326855 |
|
Nigeria |
67 |
795 |
- 944 |
-0,842161 |
|
Guinea |
66 |
1 782 |
- 1 463 |
-1,218045 |
|
Zimbabwe |
66 |
2 669 |
- 1 463 |
-1,824334 |
|
Congo (Zaire) |
65 |
822 |
- 1 982 |
-0,414733 |
|
Sierra Leone |
64 |
458 |
- 2 501 |
-0,183127 |
|
Ethiopia |
63 |
574 |
- 3 020 |
-190,0662 |
|
Equatorial Guinea |
59 |
1 817 |
- 5 096 |
-0,356554 |
4. Relation exponentielle entre le Q.I et le salaire moyen (relation plus correcte que la régression linéaire)
Dans un article de 2006 (Exponential correlation of I.Q and the wealth of nations, Intelligence, 34, pp291-295), E. Dickerson démontre qu'une relation de type exponentielle est plus correcte pour établir le lien entre le salaire moyen et le Q.I.
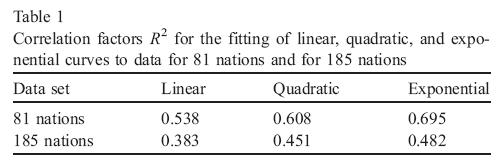
En gros, un gain de 10 points de Q.I se traduit par un doublement du salaire moyen au niveau national.
Un gain de 5 points de Q.I multiplie le salaire moyen par 1,45.
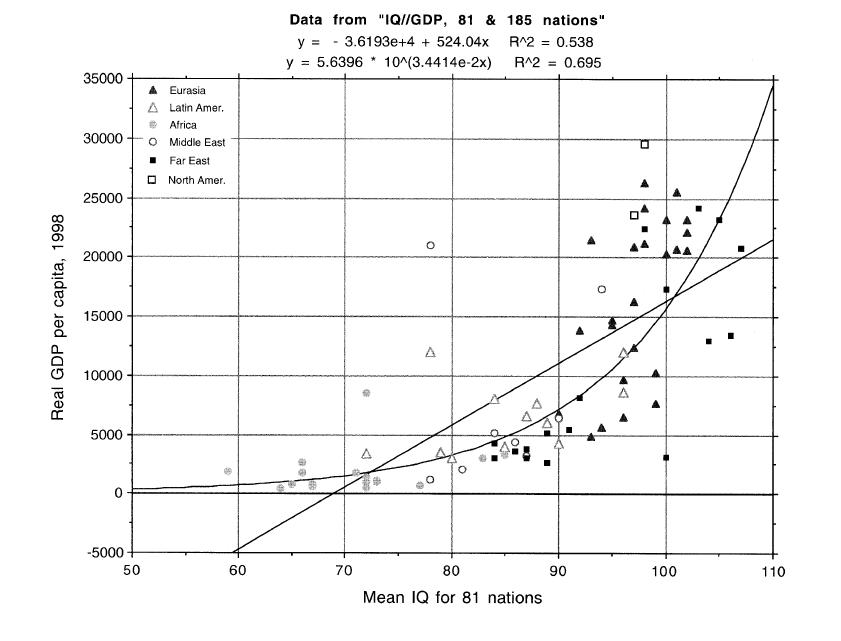
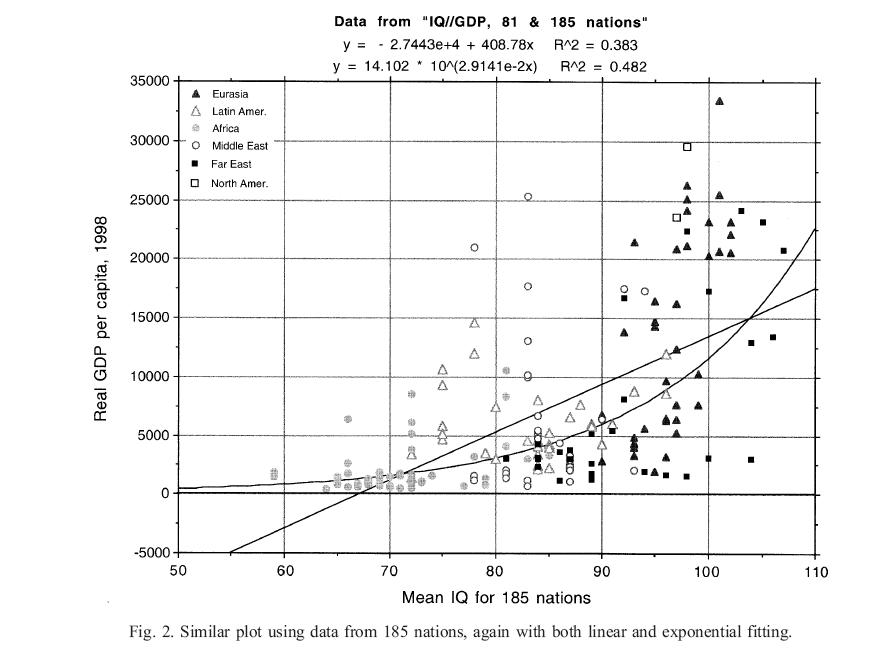
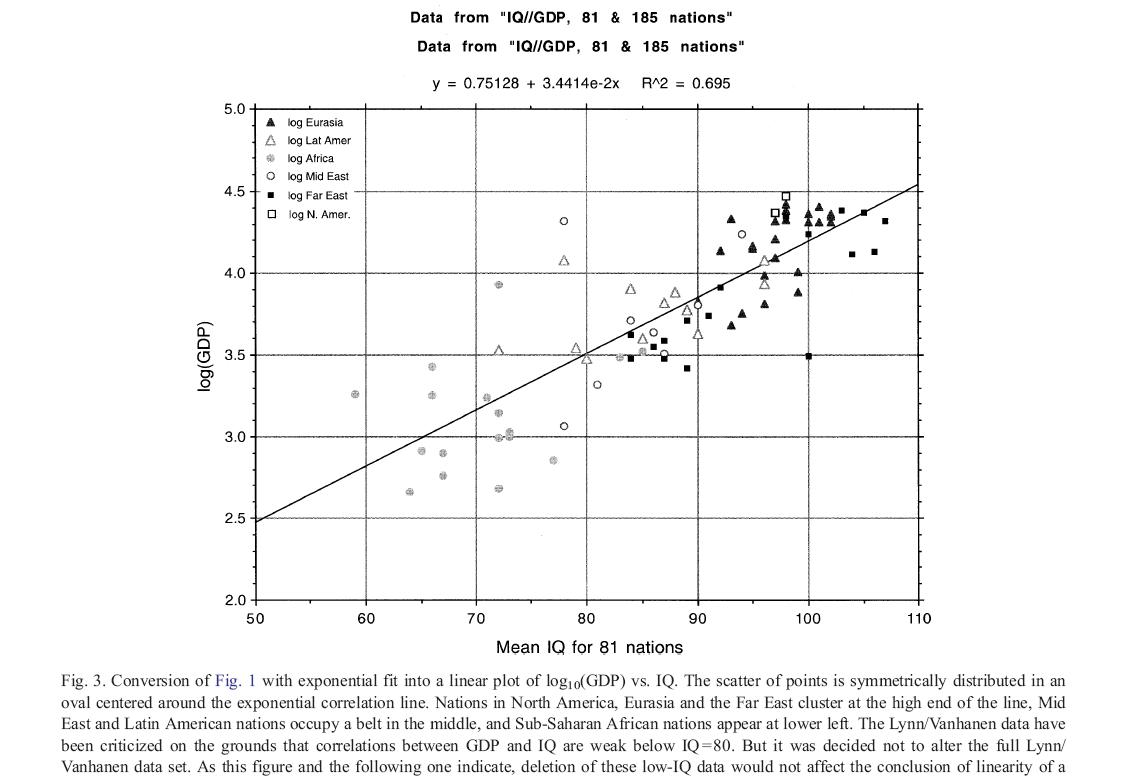

Exemple: Le Cameroun a un Q.I moyen de 70 et un salaire de 1474$.
L'Equateur a un Q.I moyen de 80 et un salaire moyen de 3003$ (à peu près le double)
La Turquie a un Q.I moyen de 90 et un salaire moyen de 6422$ (à peu près le double)
Hong-Kong avec un Q.I moyen de 107 a presque 20 points de plus que la Turquie et a un salaire de 20763$, presque 2.2 = 4 fois le salaire moyen turque.
QHC: quality of human conditions, indice de développement humain
PPP GNI per capita 2002: Salaire moyen par habitant en 2002
|
All countries |
Estimate IQ |
Total |
|
|
QHC |
0.805 |
0.725 |
0.791 |
|
PPP GNI per capita 2002 |
0.693 |
0.342 |
0.616 |
|
Adult literacy rate 2002 |
0.642 |
0.655 |
0.655 |
|
Tertiary enrollment ratio |
0.746 |
0.699 |
0.745 |
|
Life expectancy at birth 2002 |
0.765 |
0.690 |
0.750 |
|
Index of Democratization 2002 |
0.569 |
0.322 |
0.530 |
|
Excluding smallest countries |
Calculated IQ |
Estimate IQ |
Total |
|
QHC |
0.846 |
0.800 |
0.839 |
|
PPP GNI per capita 2002 |
0.739 |
0.266 |
0.649 |
|
Adult literacy rate 2002 |
0.710 |
0.746 |
0.733 |
|
Tertiary enrollment ratio |
0.778 |
0.734 |
0.780 |
|
Life expectancy at birth 2002 |
0.833 |
0.753 |
0.817 |
|
Index of Democratization 2002 |
0.598 |
0.408 |
0.584 |
|
|
|
Latitude et température
|
Correlation |
Latitude |
Temperature |
|
Degrees latitude |
1 |
-0.885 |
|
Annual mean temperature |
-0.885 |
1 |
|
National IQ |
0.677 |
-0.632 |
|
QHC |
0.659 |
-0.562 |
|
PPP GNI per capita 2002 |
0.528 |
-0.407 |
|
Adult literacy rate 2002 |
0.482 |
-0.467 |
|
Tertiary enrollment ratio |
0.718 |
-0.649 |
|
Life expectancy at birth 2002 |
0.505 |
-0.379 |
|
Index of Democratization 2002 |
0.512 |
-0.460 |
Indice de développement humain (2009) en fonction du Q.I moyen national

From « Intelligence, an unifying factor for the social science, Lynn et Vanhanen, 2012.